
Using Real Resale Data
The problem with “one number” pricing
One of the most common questions I see in resale groups is simple on the surface and surprisingly hard in practice:
“What should I price this at?”
Most people want to move an item reasonably fast and get a fair price. But resale markets are noisy. Prices fluctuate. Similar items sell for different amounts. And it’s not always obvious which data actually matters.
Over time, I’ve landed on a repeatable way to approach pricing that doesn’t rely on guesswork or gut instinct alone. It’s not about finding the perfect number. It’s about understanding the factors that shape a good decision.
When people ask what something is “worth,” they’re often hoping for a single answer. But resale data rarely works that way.
The same item can sell:
- At different prices
- In different amounts of time
- Based on condition, color, timing, and presentation
That doesn’t mean the data is useless. It means it needs context.
What matters most isn’t the highest price you can find. It’s understanding:
- What range items are actually selling in
- How long those sales took
- Whether higher prices consistently mean slower movement (or not)
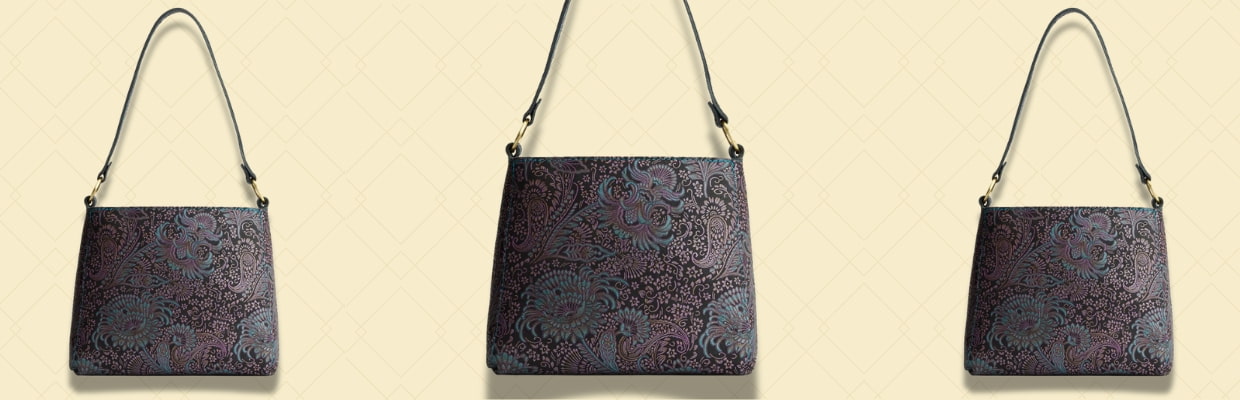
A real example: pricing a Triangle Bag
I recently recorded a short walkthrough showing how I price a real bag using recent resale data from Leather Ledger.
In the video, I walk through:
- Filtering to a specific product and color
- Looking at price ranges instead of just averages
- Comparing Days on Market across listings
- Checking individual sales to understand outliers
What’s interesting in this example is that the highest-priced sale actually moved the fastest. That’s not always the case, but it’s a good reminder that pricing decisions aren’t linear. Listing quality, timing, and visibility all play a role.
This is exactly why I like working from ranges and patterns instead of fixed rules.
Watch the walkthrough
If you’re curious how this looks in practice, here’s the full walkthrough video:
👉 Watch: How I Price a Bag Using Real Resale Data
This isn’t a promise of outcome. It’s simply the process I use when deciding where to list and how to price an item based on what the market is actually doing.
The numbers will change. The thinking stays the same.
A Note on Thin Data and “Unicorns”
Sometimes you’ll see more than a dozen recent sales. Other times only a few, or none at all if an item or color is especially rare.
That’s normal.
In those cases, pricing becomes less about averages and more about:
- Similar items
- Broader category trends
- Your own tolerance for a quick sale vs. price
Good data doesn’t remove judgment. It supports it.
Where this fits into Leather Ledger
This walkthrough uses the same dashboards available to members, where you can:
- Filter by product, color, size, condition, quality, and date
- View recent sales and pricing ranges
- See individual sold listings, including Days on Market and sold dates
If you’re already a member, this is a good example of how the different sections of the dashboard work together.
If you’re not a member, this walkthrough shows how having this data in one place can dramatically shorten research time and helps you make pricing decisions with greater clarity and confidence.